

The impact of strong data on the future of American Stock prices
This comes after the release of strong U.S. inflation data, which showed that the U.S. economy remains resilient and strong despite higher interest rates.

Today’s market analysis on behalf of Rania Gule Market Analyst at XS.com
Since the beginning of trading on Thursday, U.S. stock market indicators have been preparing for clear gains. The S&P 500 index is currently trading at $4,500, up 0.4%, while the Dow Jones index has risen by 0.3% or about 100 points, and the Nasdaq 100 has added about 0.5%. This comes after the release of strong U.S. inflation data, which showed that the U.S. economy remains resilient and strong despite higher interest rates. These gains are accompanied by increasing confidence that the Federal Reserve will not raise interest rates at its upcoming meeting, following modest inflation rates in August.
I believe that the markets were only slightly affected by yesterday’s consumer inflation report, as last month’s price increases are unlikely to prompt the Federal Reserve to change its monetary policy direction. Expectations suggest a 97% chance that the Fed will keep interest rates unchanged at their meeting on September 19th and 20th.
With the release of August data on producer prices and retail sales, as well as today’s jobless claims reading, the momentum of U.S. stock indices increased when the news was released. The data showed a 0.6% increase in producer prices in August compared to the previous month, and a 1.6% year-on-year gain in prices, accelerating from a 0.3% monthly increase in July. Retail sales data for August showed significant strength compared to the previous month, confirming that the American consumer remains resilient despite rising interest rates. Retail sales increased by 0.6% in August compared to the previous month, higher than Wall Street’s estimate of 0.1%. Sales excluding autos and gas also rose by 0.2%, higher than the expected 0.1% decline.
These data points come ahead of the Federal Reserve’s policy meeting next week. The August report from the Commerce Department, which provided a quick glimpse of consumer spending, came at a time when economic data was much stronger than expected, despite the Federal Reserve’s interest rate hikes aimed at taming stubbornly high inflation.
Following the strong data that supported U.S. stock markets and pushed them to historic levels, attention will also turn to the first-ever listing of Arm shares on the Nasdaq later today. This comes after the electronic chip design company backed by Softbank priced its initial public offering at $51 per share, with a valuation of $52 billion.
Markets are also focused on the ongoing rise in oil prices, given its significant impact on inflation and global stock markets. Crude oil and Brent crude are currently trading near their highest levels in 10 months. Therefore, I believe that the current gains in U.S. stock markets may continue in the short and medium term, but they are unlikely to last long, especially with the strength of the dollar still dominating global markets.
Technical analysis for the S&P500:
From the chart, I can see that the S&P 500 index is approaching its highest level at $4,609 and is poised to retest the strong resistance zone between $4,514 and $4,545. If the price breaks through this level and holds above it on the four-hour chart, it will serve as support for targeting the price to the peak at $4,610 thereafter. Additionally, technical momentum indicators are giving strong buy signals, supporting the bullish scenario in the short and medium term, especially as the price continues to trade above the 200-day simple moving average on the daily chart.
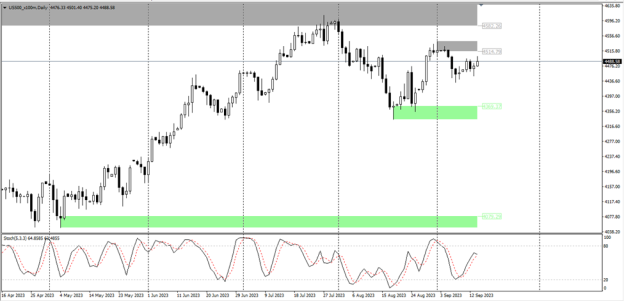
S&P500 price chart – MT4 platform from XS.com
However, in case the price reverses and fails to break above the mentioned resistance, it will target support levels at $4,369. This would signify a continuation of the sideways range-bound trend that the index has been in recently. Breaking below levels of $4,360 and $4,335 and holding below them would serve as support for the beginning of a modest downtrend on the S&P 500 in the medium term, until it breaks below the 200-day simple moving average at $4,288 and holds below it, thus confirming a long-term bearish scenario.