

Bitcoin Price Predictions: Where Will It Reach in 2024?
Bitcoin (BTC) rose to start Monday's trading at $48,150, and its market value increased by around 13.5% in the seven days leading up to February 12th, marking the largest weekly increase since October.
The BTC/USD buying transactions witnessed a positive week, with major cryptocurrencies adding gains of approximately +10.7%. Bitcoin (BTC) rose to start Monday’s trading at $48,150, and its market value increased by around 13.5% in the seven days leading up to February 12th, marking the largest weekly increase since October.
It’s worth noting that this surge occurred while continuous flows into U.S.-based cryptocurrency exchange-traded funds (ETFs) are likely to dominate, and reports suggest that the bankrupt cryptocurrency bank “Genesis” is seeking approval to liquidate its $1.6 billion worth of Bitcoin assets. On Thursday, ETFs accumulated over $400 million in cash inflows, recording the best day in almost a month.
However, I believe the entire Bitcoin ETF investment thesis has not played out as expected. Bitcoin has dropped by approximately 10% since the trading of ETFs started on January 11. Could another major catalyst be coming this year, and is it possible for Bitcoin’s price to reach new historical levels?
In my view, the disappointing part of the original Bitcoin ETF investment thesis is that the price did not rise in January. While the new Bitcoin ETFs seem to have early success, all new purchases by Wall Street investors did not lift the Bitcoin price. Investors seem to have shifted funds between investment products without a real change in their overall Bitcoin investment volume.
The extent of Bitcoin’s rise this year depends significantly on the number of new investments in portfolios dedicated to cryptocurrencies. Assuming that 1% remains the general rule for most investors, reaching $100,000 may be harder than expected. However, if markets are willing to flip things and shift this allocation percentage to 5%, 10%, or even 20%, Bitcoin could reach historical levels, although I consider this possibility less likely.
I believe the Bitcoin ETF story will not be the biggest event for Bitcoin this year. The long-awaited Bitcoin halving in April could bring a massive amount of liquidity to the cryptocurrency. Previous Bitcoin halving in 2012, 2016, and 2020 each led to significant price increases. For example, the 2020 halving ultimately led Bitcoin to its all-time high of around $69,000.
So, will we see another all-time high for Bitcoin in 2024? Past historical performance does not guarantee future performance, so assuming that Bitcoin will rise again this time is risky. It may take 12 to 18 months for all gains from the halving event to materialize, meaning we might not see the true extent of Bitcoin’s price increase until sometime in 2025, making long-term investment the safer option.
It seems highly logical to expect the Bitcoin price halving event to be extremely impactful. Cutting the mining reward paid by Bitcoin for adding a new block to the network in half, will have two important consequences. Firstly, it will enhance the relative scarcity of Bitcoin. Secondly, it will make Bitcoin more attractive over time. These two outcomes could make the Bitcoin price rise in the long term.
Based on the above, I expect Bitcoin’s price to become less volatile over time. It will become more correlated with traditional asset classes, potentially leading to more stability in Bitcoin prices. However, it could continue to rise in the long term, but I don’t believe it has a chance to breach the $100,000 level by the end of this year.
Technical Analysis of the Bitcoin (BTC) Prices:
On the weekly chart, we observe that the price movement retested support at $38,809 in January, forming a bullish candlestick pattern known as a hammer, signaling an upward trend. Indeed, the uptrend has continued since then. However, it stabilized sideways last week around the resistance at $45,968 before rallying again, poised to reach its highest levels since January 11th, near $49,099.
The weekly close above $45,968 supported the price targeting the weekly resistance at $51,952 in the coming weeks. This theory is further confirmed by the fact that the weekly timeframe shows the price movement trending higher in the form of successive higher peaks and lower troughs since November 2022.
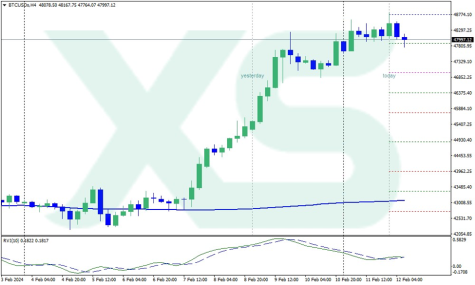
BTC – Prices Chart –-XS.com MT4.
Also, on the 4-hour chart, the Relative Strength Index (RSI) indicates a rapid approach to the overbought territory, supporting the continuation of the price rally during this week. The next resistance that the price needs to surpass to continue its ascent is located at $48,910. Therefore, if the price retraces downward, a retest of the daily support at $46,331 may occur, providing enough technical strength for new buying positions and targeting higher levels.
In another scenario, in the case of a breakout above $49,099, the price could reach levels of $50,000 and $51,000 for this week. This movement might lead to a bounce in a corrective pattern, followed by a continuation of the upward trend towards new highs. However, prices continue to move within positive levels of technical indicators, calling for caution before making new trading decisions on Bitcoin in the near term.